GEO-KOMPSAT-2A · 1692 MHz · Korea
A hidden weather-chart channel
The same Korean satellite that gives us the full-disk timelapse sends a second stream on the same signal: the weather service's own charts. It is easy to miss, so almost nobody saves it. We pulled it out of one overnight recording.
What is on it
- 13 chart products from the Korea Meteorological Administration: wave models, upper-air and surface charts, sea-surface temperature, fog.
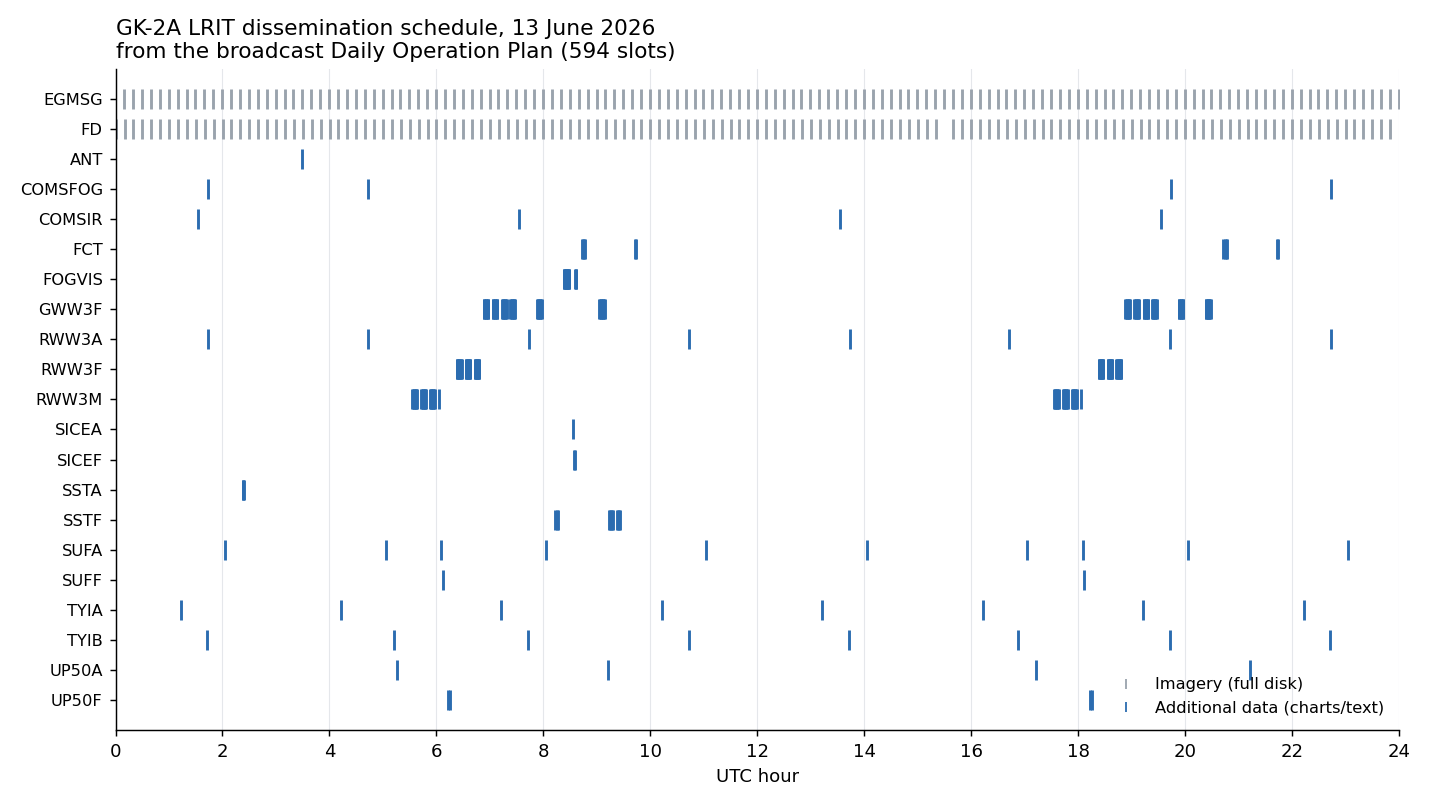
- A daily operation plan in plain text, the satellite's own broadcast schedule, which even announced a thruster maneuver at 15:28 UTC.
- It rides the exact same downlink as the imagery. Error-correction recovered the charts to near-complete despite night-time signal fades.
The charts
-
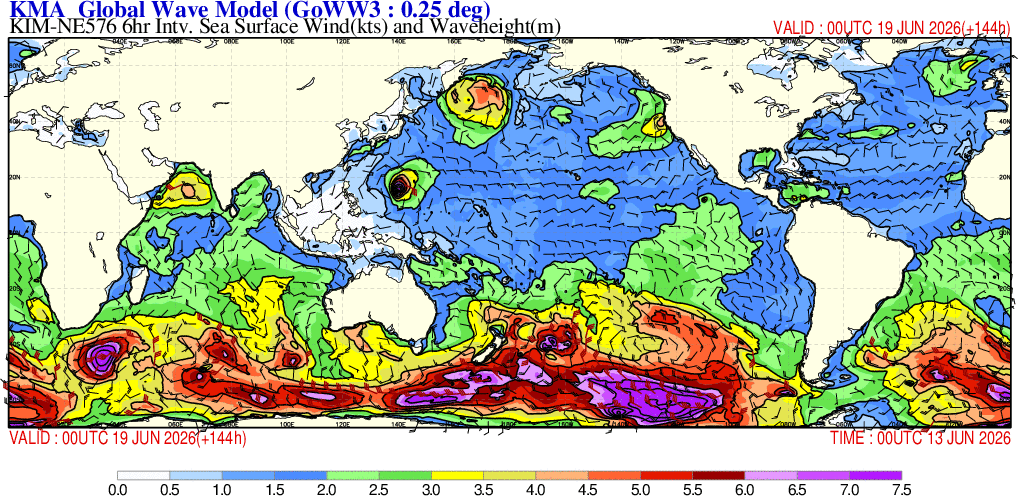 GWW3F
GWW3FGlobal wave model
-
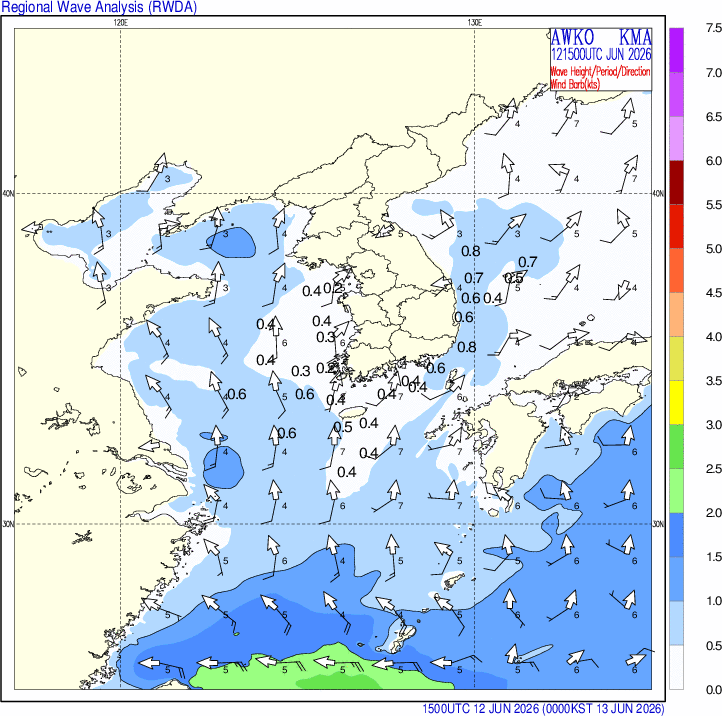 RWW3A
RWW3ARegional wave analysis
-
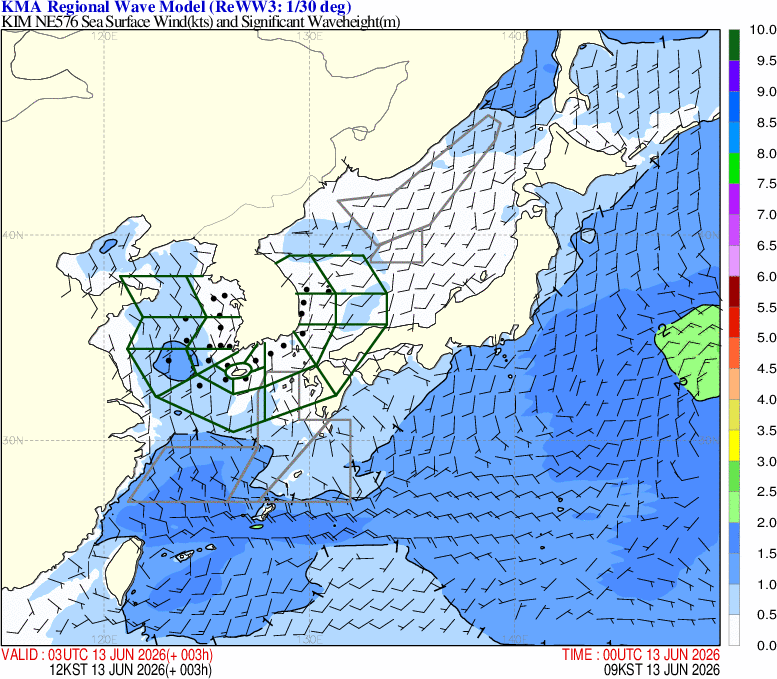 RWW3F
RWW3FRegional wave forecast
-
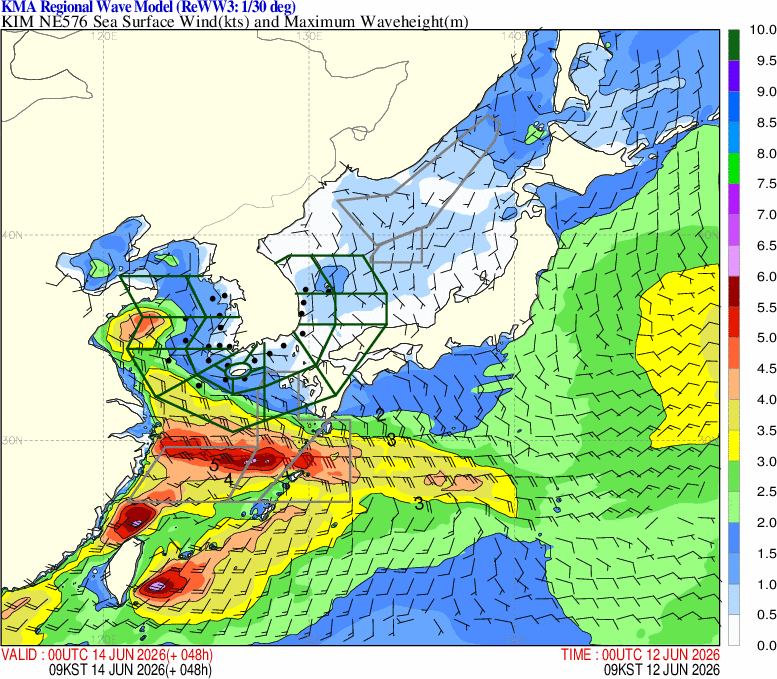 RWW3M
RWW3MRegional wave, model run
-
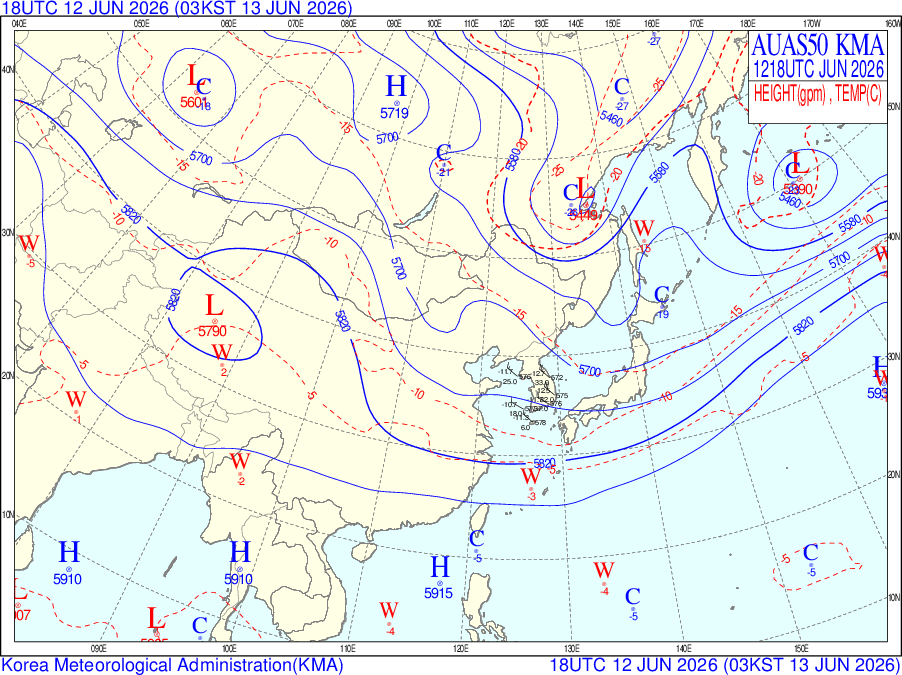 UP50A
UP50A500 hPa analysis
-
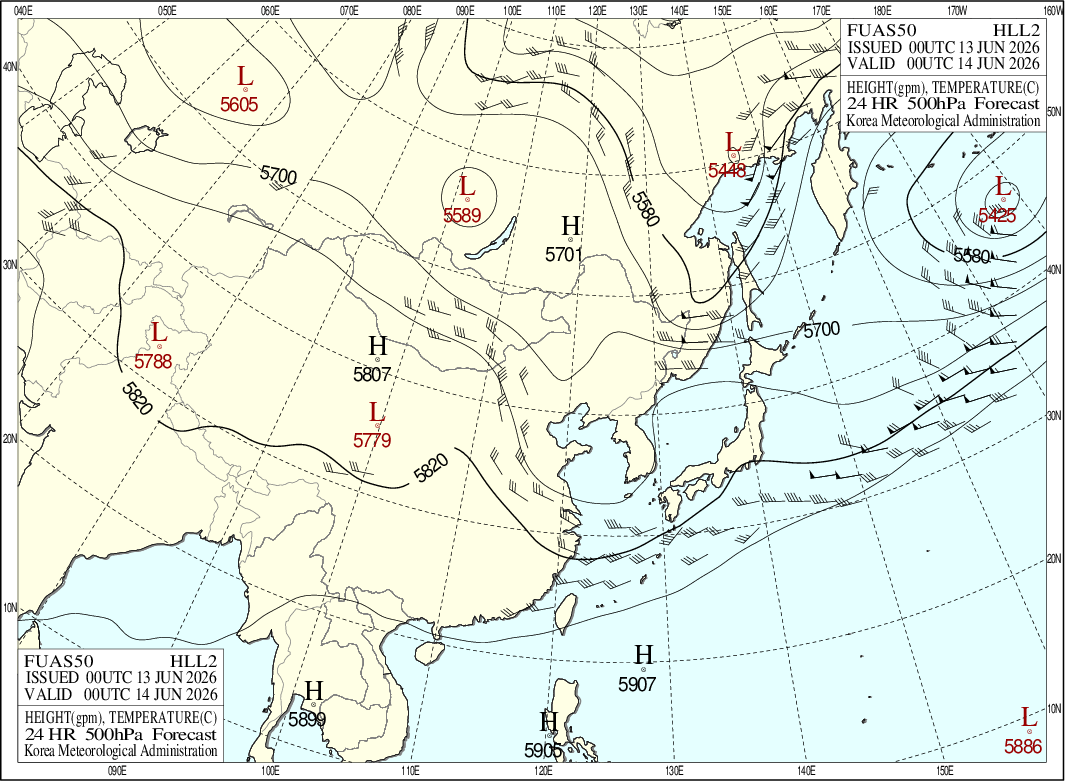 UP50F24
500 hPa forecast, +24 h
-
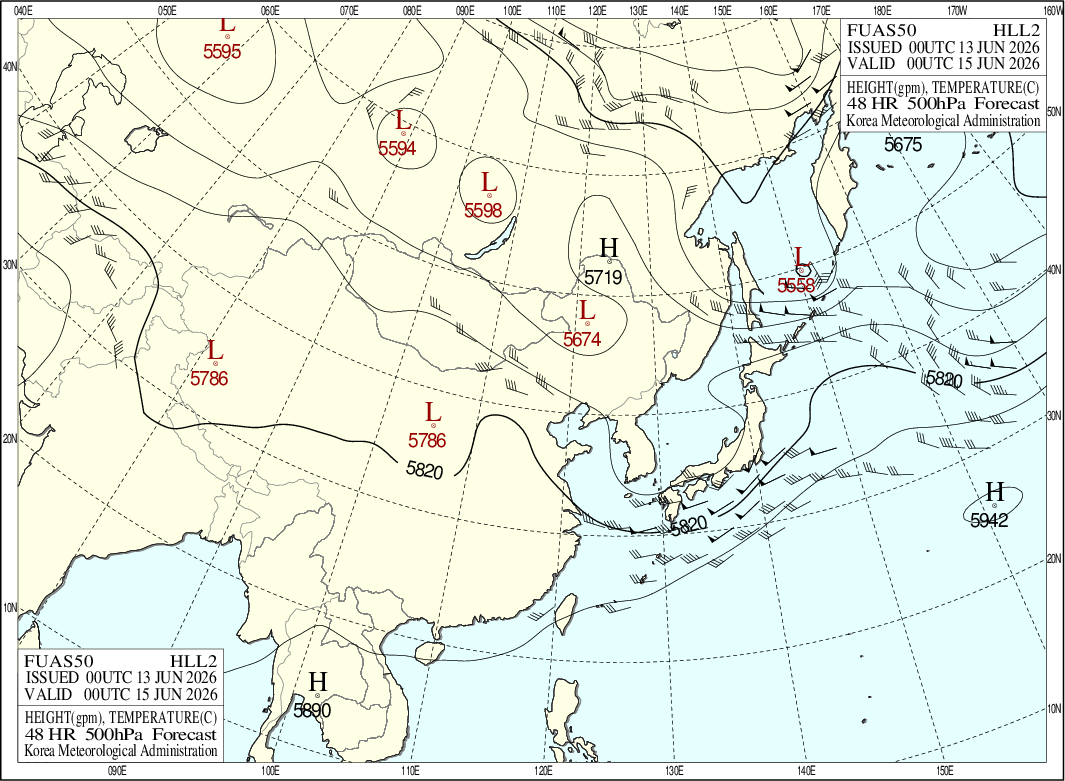 UP50F48
500 hPa forecast, +48 h
-
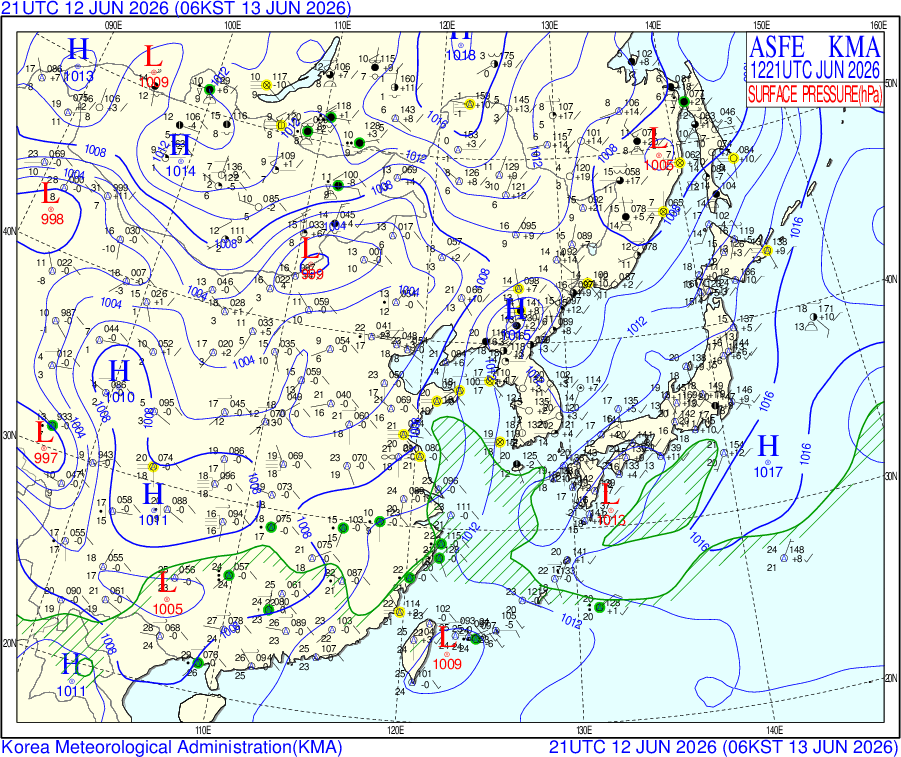 SUFA03
Surface analysis, +03 h
-
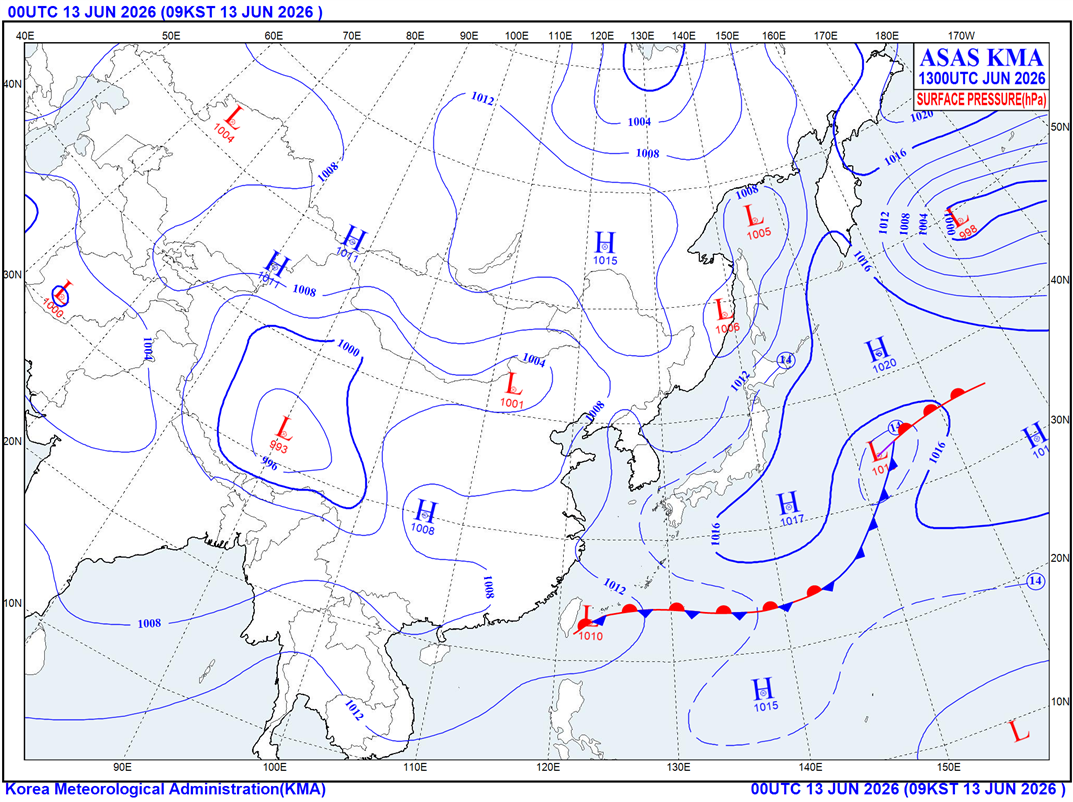 SUFA12
Surface analysis, +12 h
-
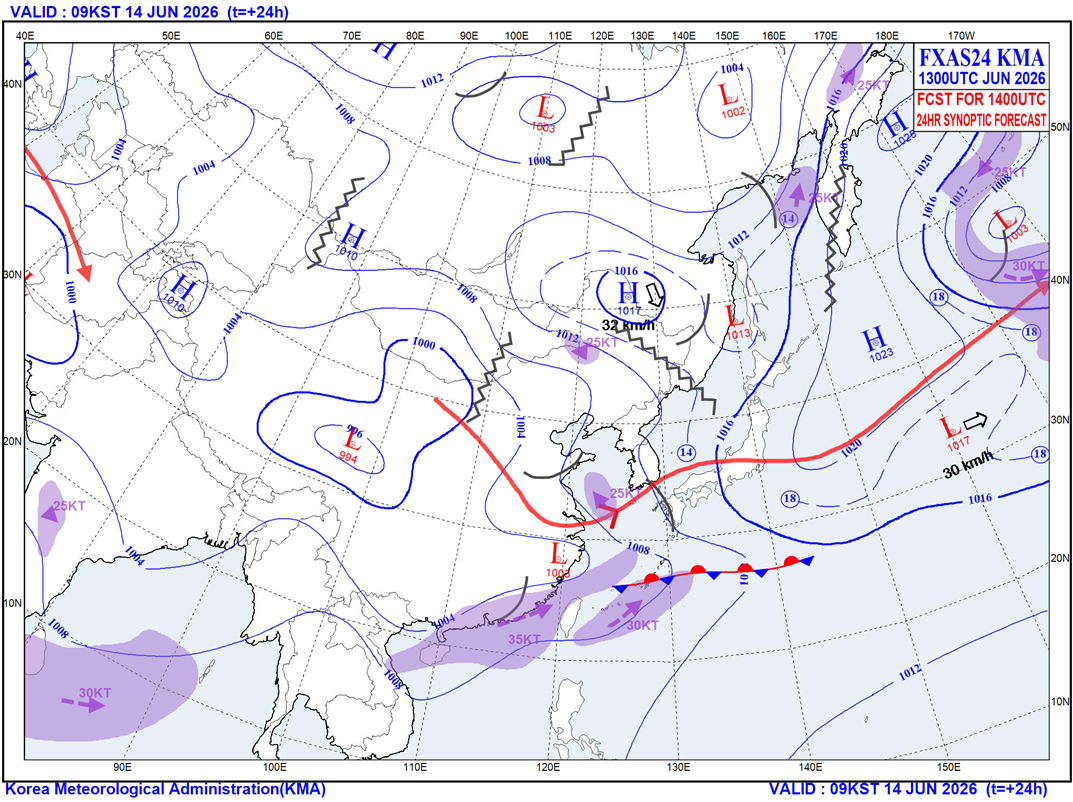 SUFF24
Surface forecast, +24 h
-
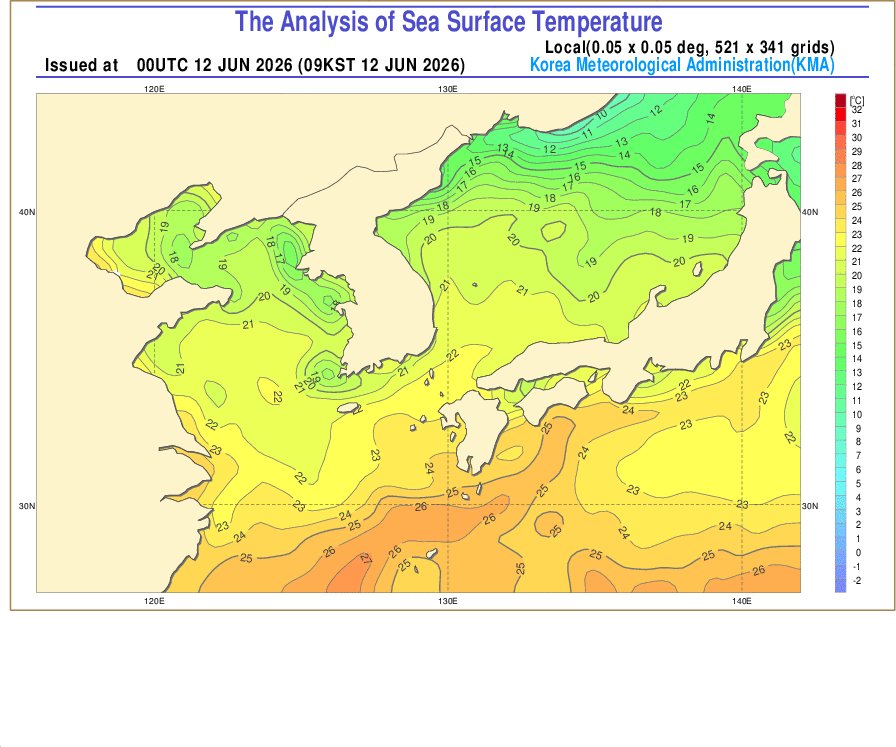 SSTA
SSTASea surface temperature
-
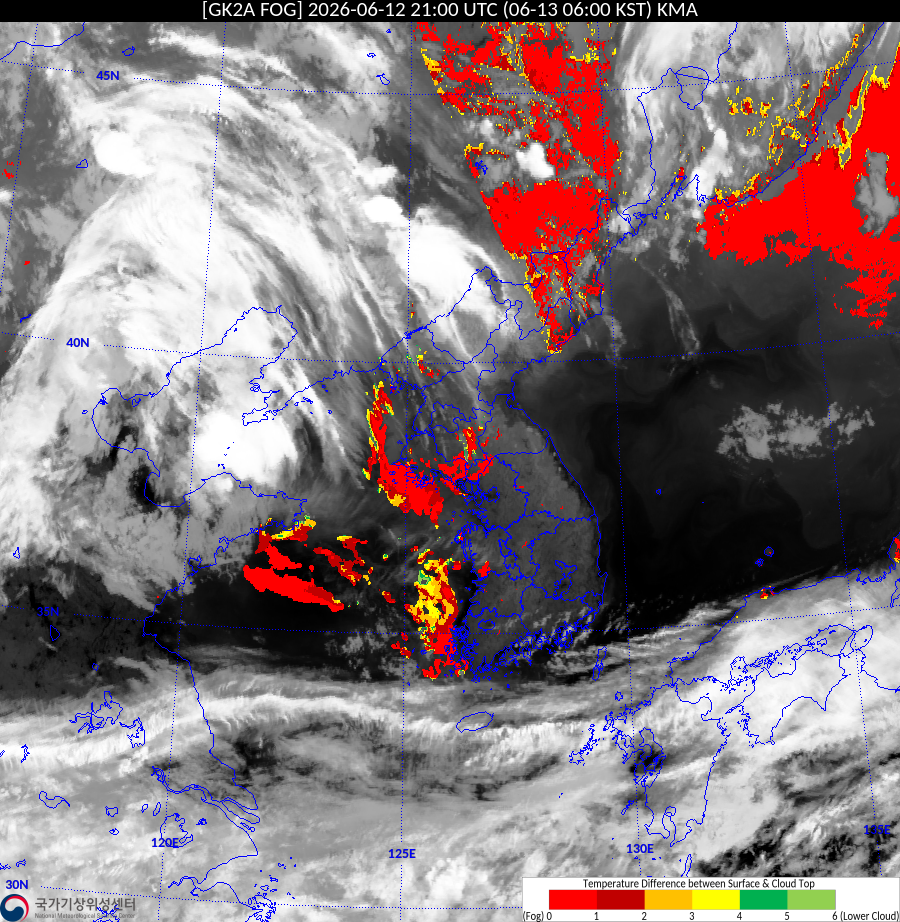 COMSFOG
Fog detection
-
 FCT
FCTForecast chart
Decoded from one overnight GK-2A recording, 12 to 13 June 2026, 60 cm dish, Mumbai. Charts via SatDump (error-corrected). Raw schedule text: Daily Operation Plan ↗.