GK-2A · IR105 10.3 micron · South Korea
Storm clouds with no typical size
GK-2A is a Korean weather satellite. We receive one of its channels, a single thermal-infrared band, on our own dish and turn the raw radio into calibrated cloud-top temperatures. From that one band, the tropical storm clouds over the Pacific warm pool turn out to have no characteristic size. The same statistical pattern repeats from tens to hundreds of kilometres, and it holds steady for hours.
What we found
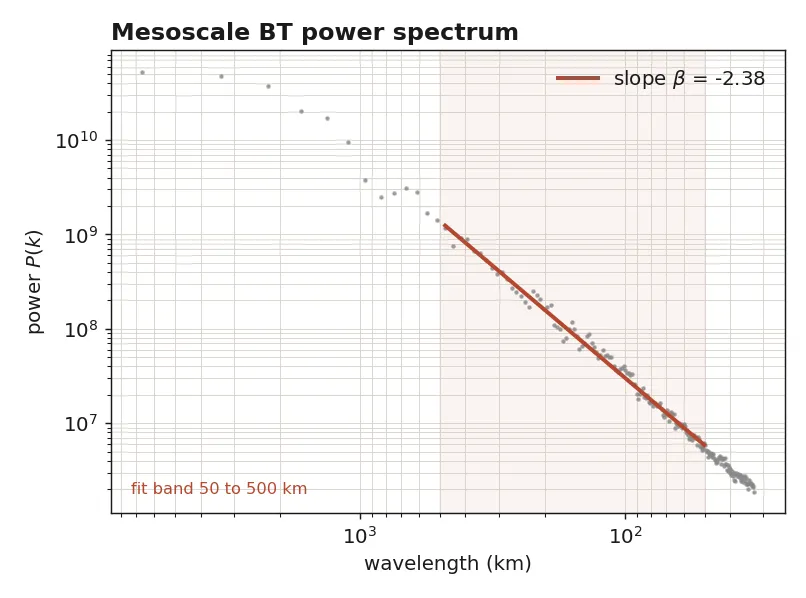
- The temperature field's power spectrum is a straight line from 50 to 500 km. A straight line means one rule at every size, with slope beta near minus 2.4. There is no preferred scale.
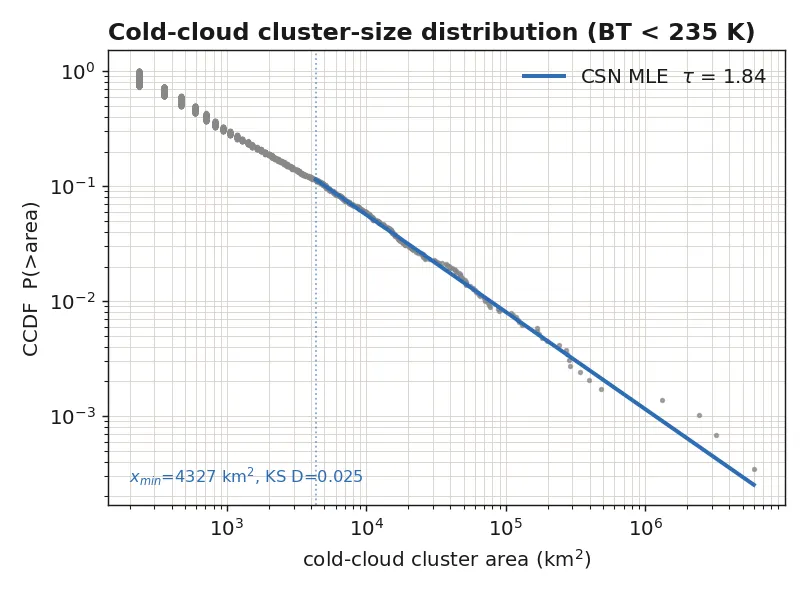
- The cold storm clusters follow a power-law size distribution, exponent tau near 1.8, fit properly by maximum likelihood. Many small, a few enormous, no typical size.
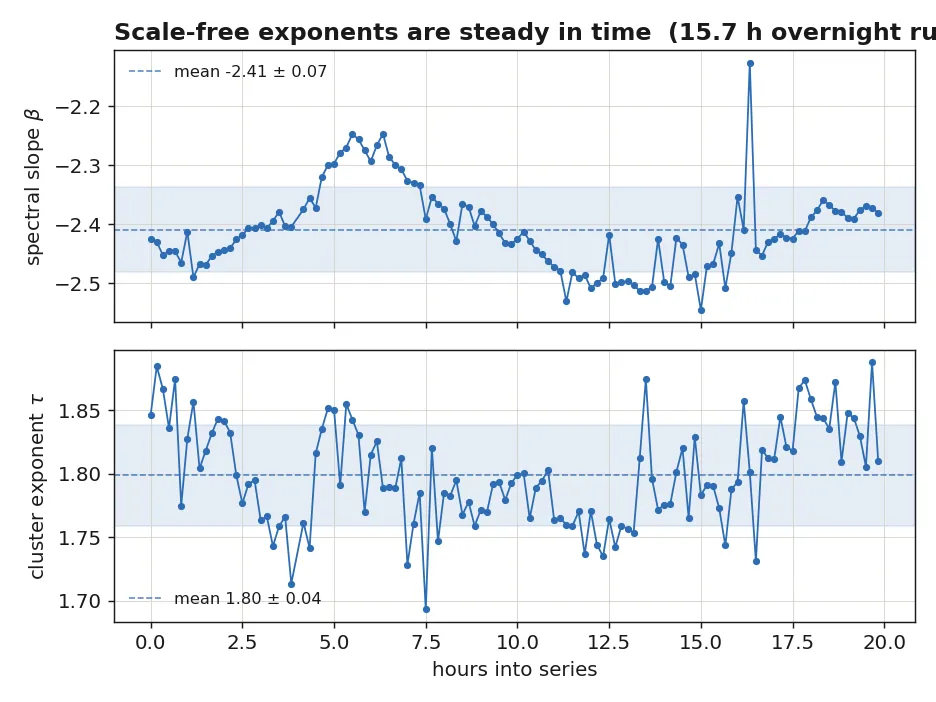
- Both numbers stay flat frame to frame, and reproduce on a second window three days apart. The steadiness is the result, not any single snapshot.
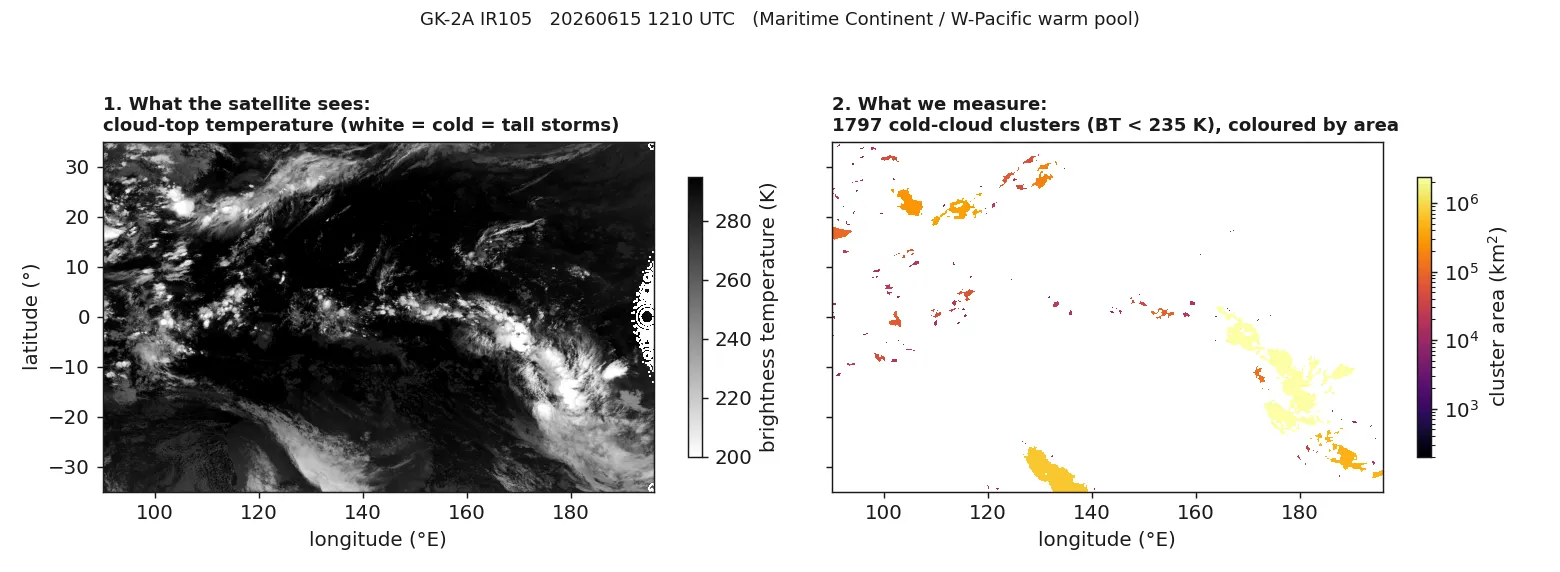
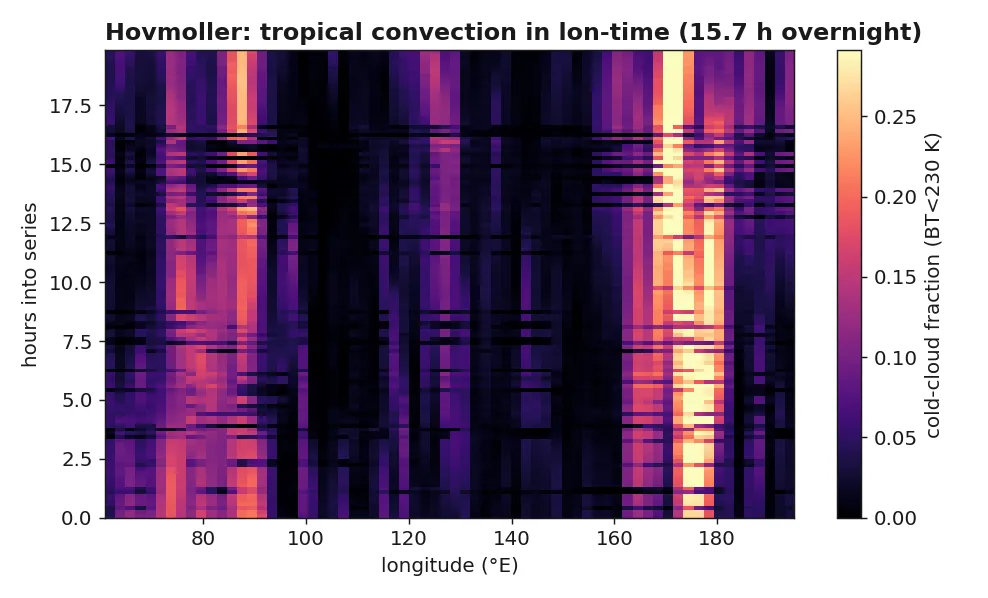
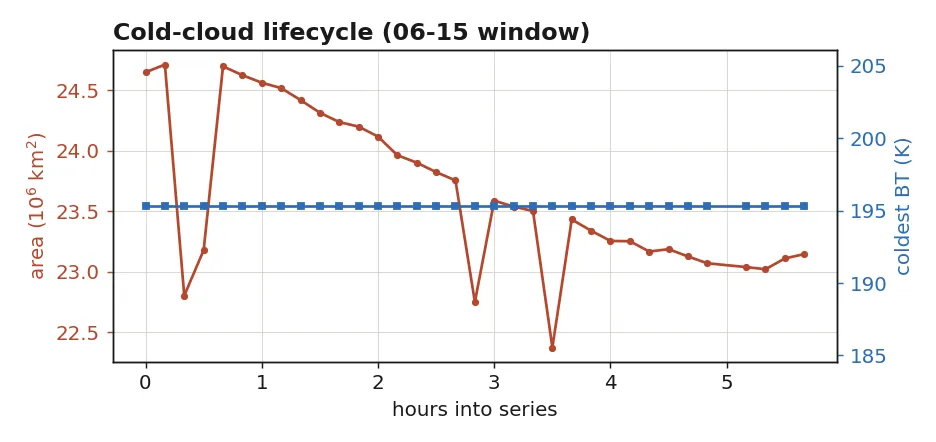
For context, the convection itself sits roughly still while it does this. It pulses in place over the warm pool rather than drifting along, and the very coldest tops stay pinned near 195 K, the ceiling the storms hit at the tropopause.
What we looked for first, and did not find
We started by hunting for convective gravity waves, the faint ripples that deep storms push through the surrounding cloud field. They are real, but they pulse every 6 to 16 minutes, and our full-disk images arrive only every 10 minutes, which aliases the ripples away. What looked like wave trains in the high-pass field turned out to be detector striping in the downlink, strongest over clear sky where there is no weather at all. So we set the waves aside and kept the two signals that survive scrutiny.
Where it stands
The temperatures come from our own decode of the GK-2A downlink, not a data feed. The scale-free result is robust across the two windows we have, 5.7 hours on one day and 15.7 hours on another. More days, and a wider-area fit, would tighten the exponents further. The receiving station is powered down for now, so the archive is frozen.
Imagery: GEO-KOMPSAT-2A AMI IR105 (10.3 micron) LRIT, received and decoded at this station. Calibration to brightness temperature, the spectral and cluster analysis, and the figures: this project. Power-law fitting follows Clauset, Shalizi and Newman; the cluster-size framing follows Wood and Field.