Elektro-L5 · 1693 MHz · live
Published
Hear a Russian weather satellite count particles
Elektro-L5 counts charged particles 36,000 km above the Indian Ocean and radios the counts down all day. A wire antenna leaning on my bedroom window picks them up, a Raspberry Pi decodes them, and the window below plays them under a minute after they happen. A week of that data also says the label everyone uses for these counts is probably wrong.
In 30 seconds
- The kit: a 1.7 m wire Yagi, a filtered preamp, a hobby RTL-SDR dongle and a Raspberry Pi 5.
- The signal: 5 kbit/s on 1693 MHz. Every 11 seconds a frame carries eleven one-second readings from the satellite's particle counter.
- The surprise: the channel labelled "protons above 600 MeV" fell 25% in two days. Protons above 500 MeV, measured by NOAA's GOES satellites in the same orbit, did not move.
- All open: the live feed, the decoder, a 10-second recording you can decode yourself, and the data and scripts behind every number here.
1. The proton channel doesn't follow the protons
The counter's byte layout comes from a community decoder, SatDump pull request #1143. It fits every frame I decode, and it names the three channels protons above 600, 800 and 1100 MeV. Nobody had checked those names, because no official data for Elektro-L5 is published. But the orbit is shared: NOAA's GOES satellites, also geostationary, publish protons above 500 MeV every five minutes. If the channel counts what it says, the two should move together.
Elektro-L5 ">600 MeV" GOES >500 MeV
They don't. Over three days the L5 channel ranged from 89 to 117% of its average and fell steadily. GOES protons stayed within 96 to 105% with no trend. The correlation is −0.12. Whatever drives this channel, it is not mostly protons above 600 MeV.
Two checks support reading the data this way. First, the values are genuine counts. For random arrivals the variance equals the mean; here it is exactly twice the mean, and in three days not one value is odd. So each count is reported doubled, which means about 40 particles a second, not 80. Second, the likeliest culprit is the radiation belt's electrons, which swing by large factors at geostationary orbit. GOES-19's electrons above 2 MeV fell from about 900 to about 360 between 28 and 30 October. Hour by hour the two series line up (r ≈ 0.6 to 0.8) only after shifting by 6 to 10 hours. That is roughly how far apart the two satellites are in local time, and local time sets the belt's daily rhythm. With 28 hours of data this is a lead, not a result.
2. The hardware is a stick on a bed
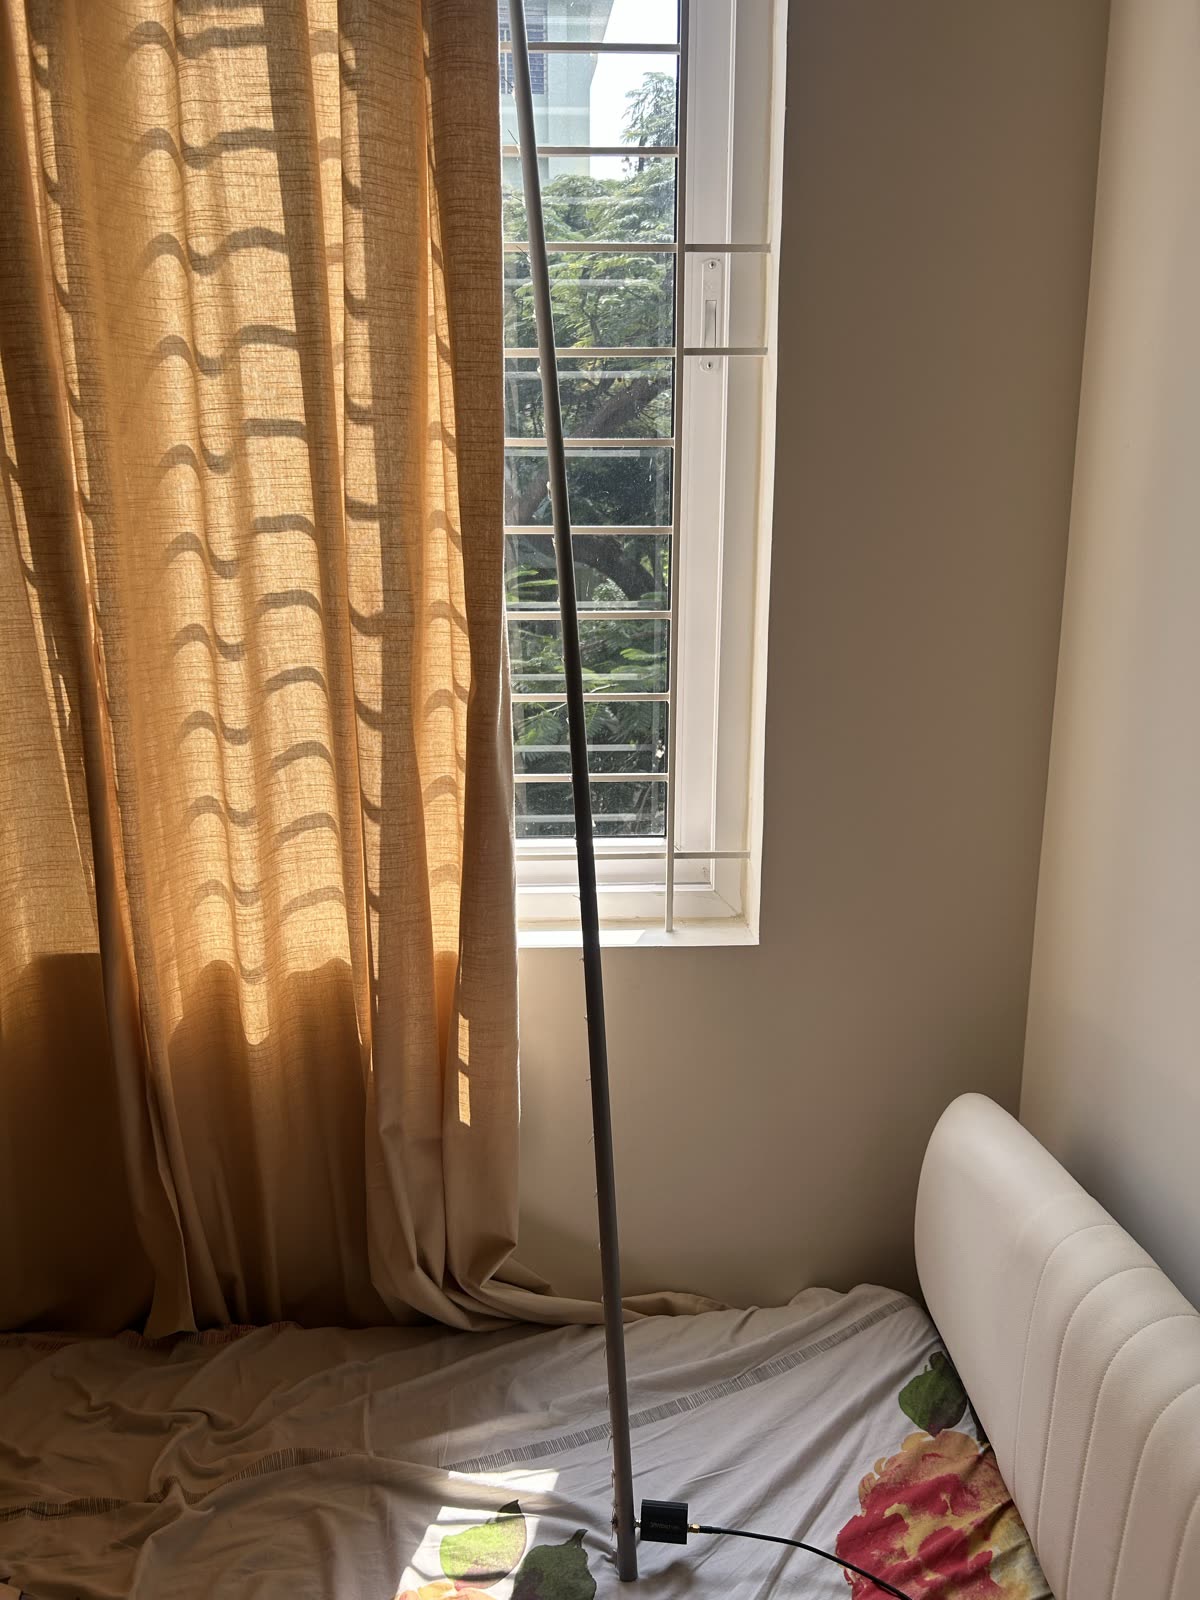
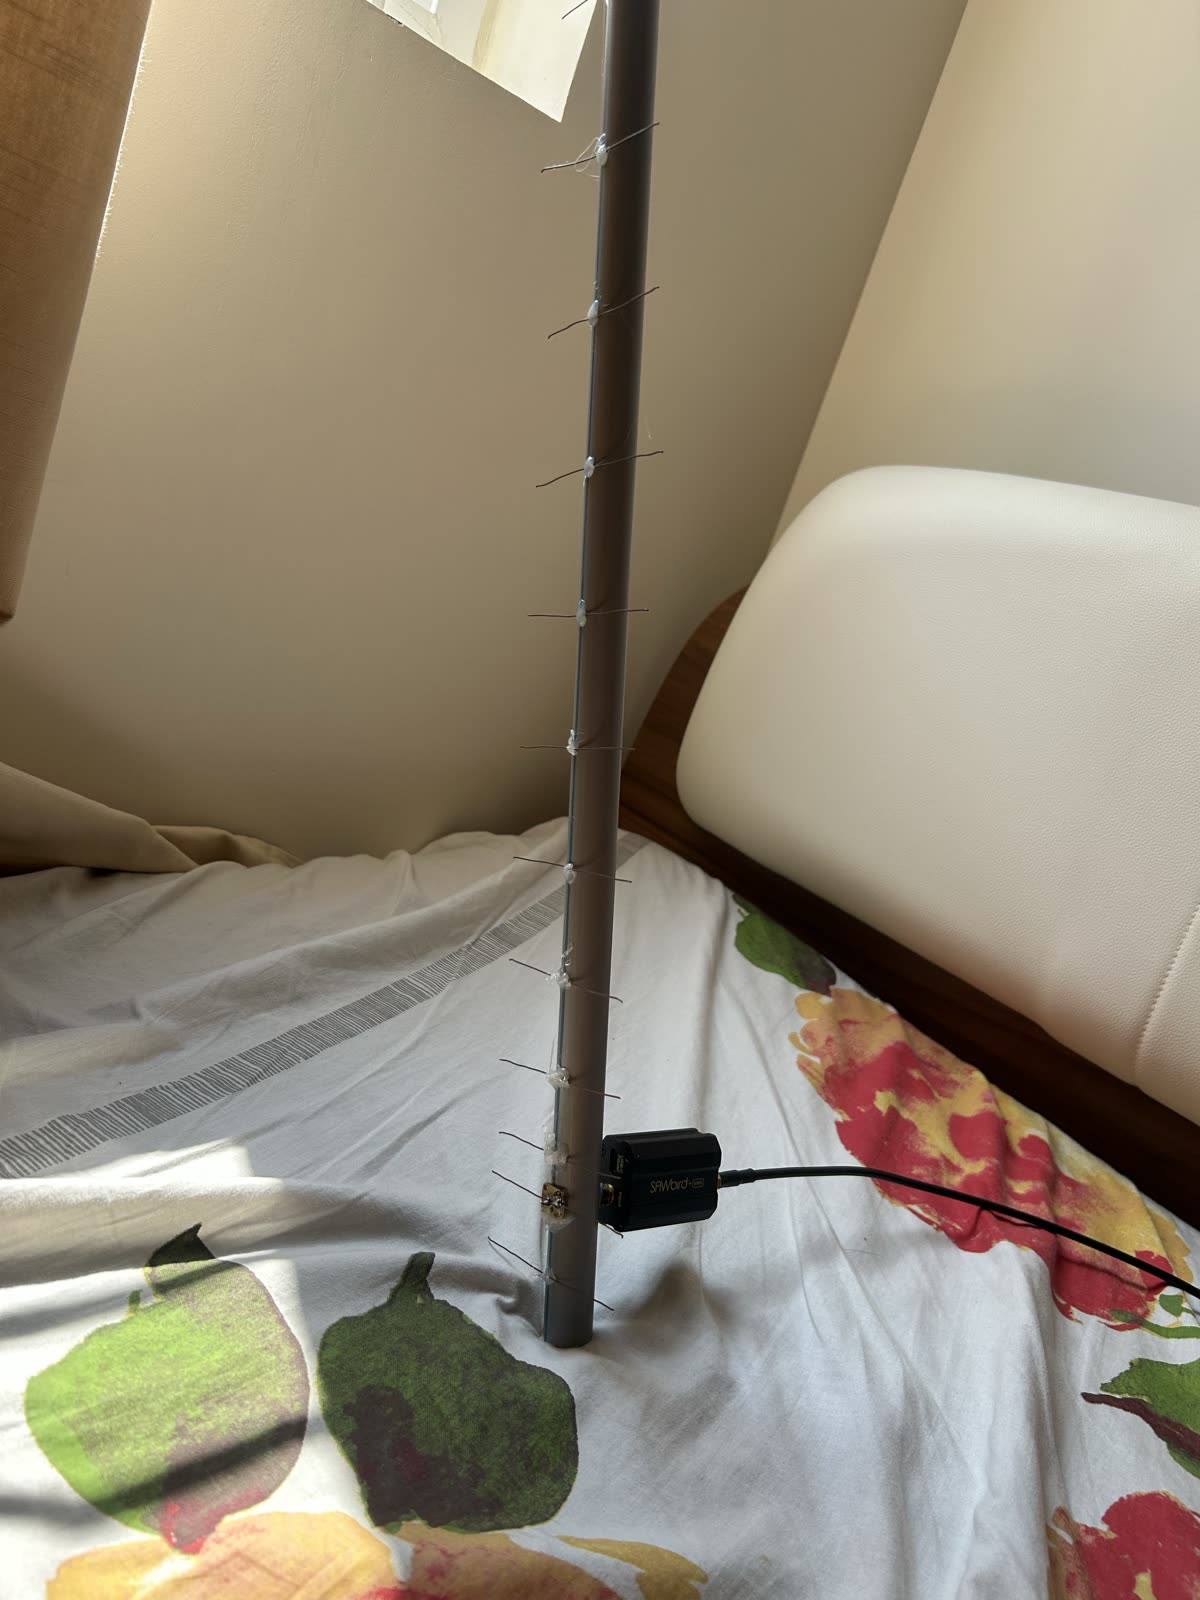
The rest is a Raspberry Pi 5 running my own decoder. It locks the carrier, demodulates the 5 kbit/s data, finds each 224-byte frame by its sync marker and keeps only frames whose checksum verifies. Each frame carries the satellite's own clock, and it matches the time of reception to the second. The decoded counts go out once a second on a public feed, which this page and the wall piece below both read.
3. Four things that broke
- Zero clean frames, and it wasn't the signal. The first decoder got none on the new antenna. Its errors came in blocks where every bit was inverted: the tracking loop kept slipping half a cycle. The new decoder has no loop. It integrates each bit against one cycle of the subcarrier, with the phase pinned to each frame's sync marker. Same signal: 49 clean frames a minute.
- The computer was jamming the antenna. With the Pi idle, 41% of frames came through clean. With it busy decoding, 4%, from the same signal in the same minute: its power regulator radiates at 1693 MHz. Now it records quietly, then decodes, and times the quiet windows to land on the particle frames.
- The satellite goes quiet every three hours. While it sends images (15 minutes,
starting at :12 and :42 past every third hour), the particle beacon drops about 8 dB:
Shaded: scheduled image downlinks. Every drop falls in one, though at 15:12 the drop lasted two minutes and at 15:42 there was none. - Repaired frames sometimes lie. When a frame fails its checksum by one or two uncertain bits, the decoder may flip them back. About 0.1% of those repairs produced wildly wrong counts, enough to fake a storm in an hourly average. The feed now drops any repaired reading more than 6σ from the recent clean median. Every number on this page uses clean frames only.
4. It also hangs on a wall
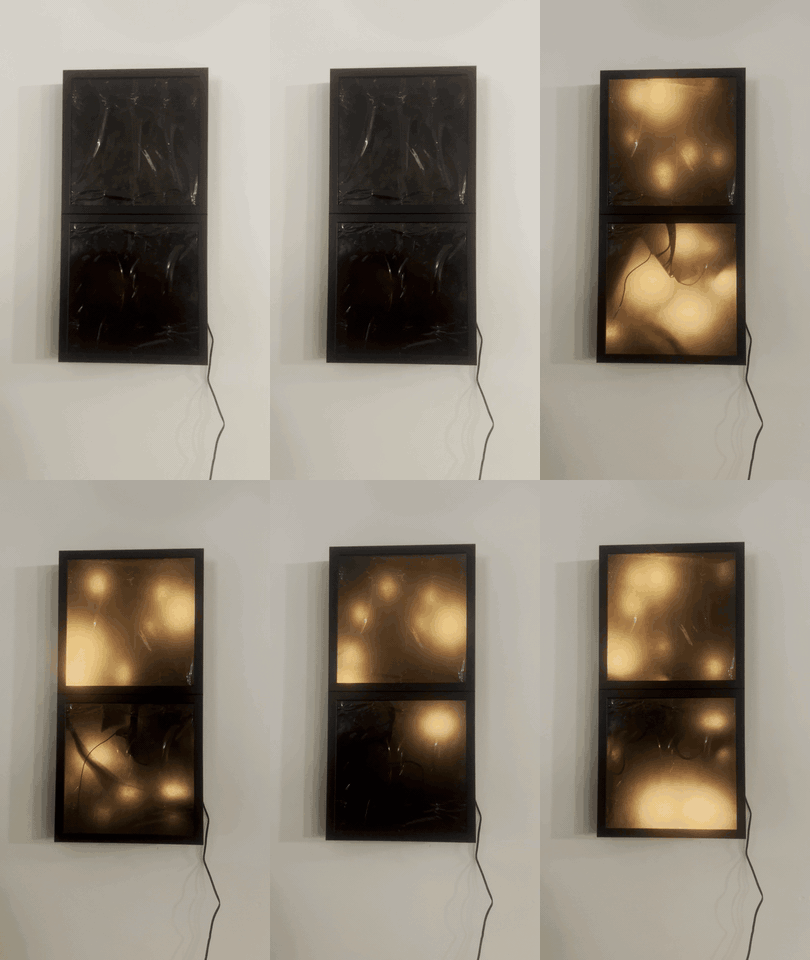
One count lights one LED, full on and then fading. The fade is quick when counts run well above the day's average and slow when it's quiet. It shows at most 20 a second, about half of them, so each flash stays a single point instead of the whole wall glowing. When the antenna is down it replays the counts this station recorded at the same time of day on earlier days, and says REPLAY on its screen. The first plan was a cloud chamber driven by the satellite. That doesn't work: a chamber shows the cosmic rays reaching the ground where it sits, and at this latitude Earth's magnetic field screens them so well that they hardly follow space weather.
5. Try it
Listen to the raw feed (public, read-only):
mosquitto_sub -h z5166a1e.ala.asia-southeast1.emqxsl.com -p 8883 \
  --capath /etc/ssl/certs -u ggak-public -P M27enNeGa2DH8w9 -t ggak/l5/sec
Decode a real 10-second recording (8 clean frames, satellite clock included):
git clone https://github.com/namanmishra07/ggak-window && cd ggak-window && pip install numpy scipy
python3 decoder/decode_file.py samples/ggak_l5_20261030_1229utc_1024ksps.cu8
Check the finding on four days of the feed and the matching GOES data:
python3 analysis/poisson_check.py data/ggak-l5-*.jsonl.gz
python3 analysis/goes_check.py   data/ggak-l5-*.jsonl.gz
Code, firmware and parts list: github.com/namanmishra07/ggak-window.
What is still open
- What the channels really count. The electron reading needs weeks of data, ideally across a geomagnetic storm, or documentation for the instrument. If you have either, I would like to hear from you.
- Calibration. The counts are raw. Turning them into flux needs the detector's geometry, which is not public.
- The images. The image downlink that steals the beacon's power is 1 to 2 dB beyond this antenna.
Back story: decoding the sibling satellite Elektro-L2 (June) and the first L5 frames off my own dish (July). Counter layout and channel names from SatDump PR #1143; decode checked against SINP's published L2 data. GOES data: NOAA SWPC. Hardware: RTL-SDR Blog V4, Nooelec SAWbird+ GOES, Raspberry Pi 5; ESP32, WS2812B, SSD1306.