
12 to 13 June 2026 · one frame every 10 min across ~20 hours · Sanchez-colorized Open the full timelapse ↗
One dish, one satellite, one log.
A 3D-printed 60 cm parabolic dish, pointed at elevation 25°, azimuth 103° true. It receives one geostationary weather satellite and decodes the images live, as they come down.
- On file
- 35
- GK-2A
- 30
- Polar
- 01
- Pointing
- 103° / 25°
Frontier work
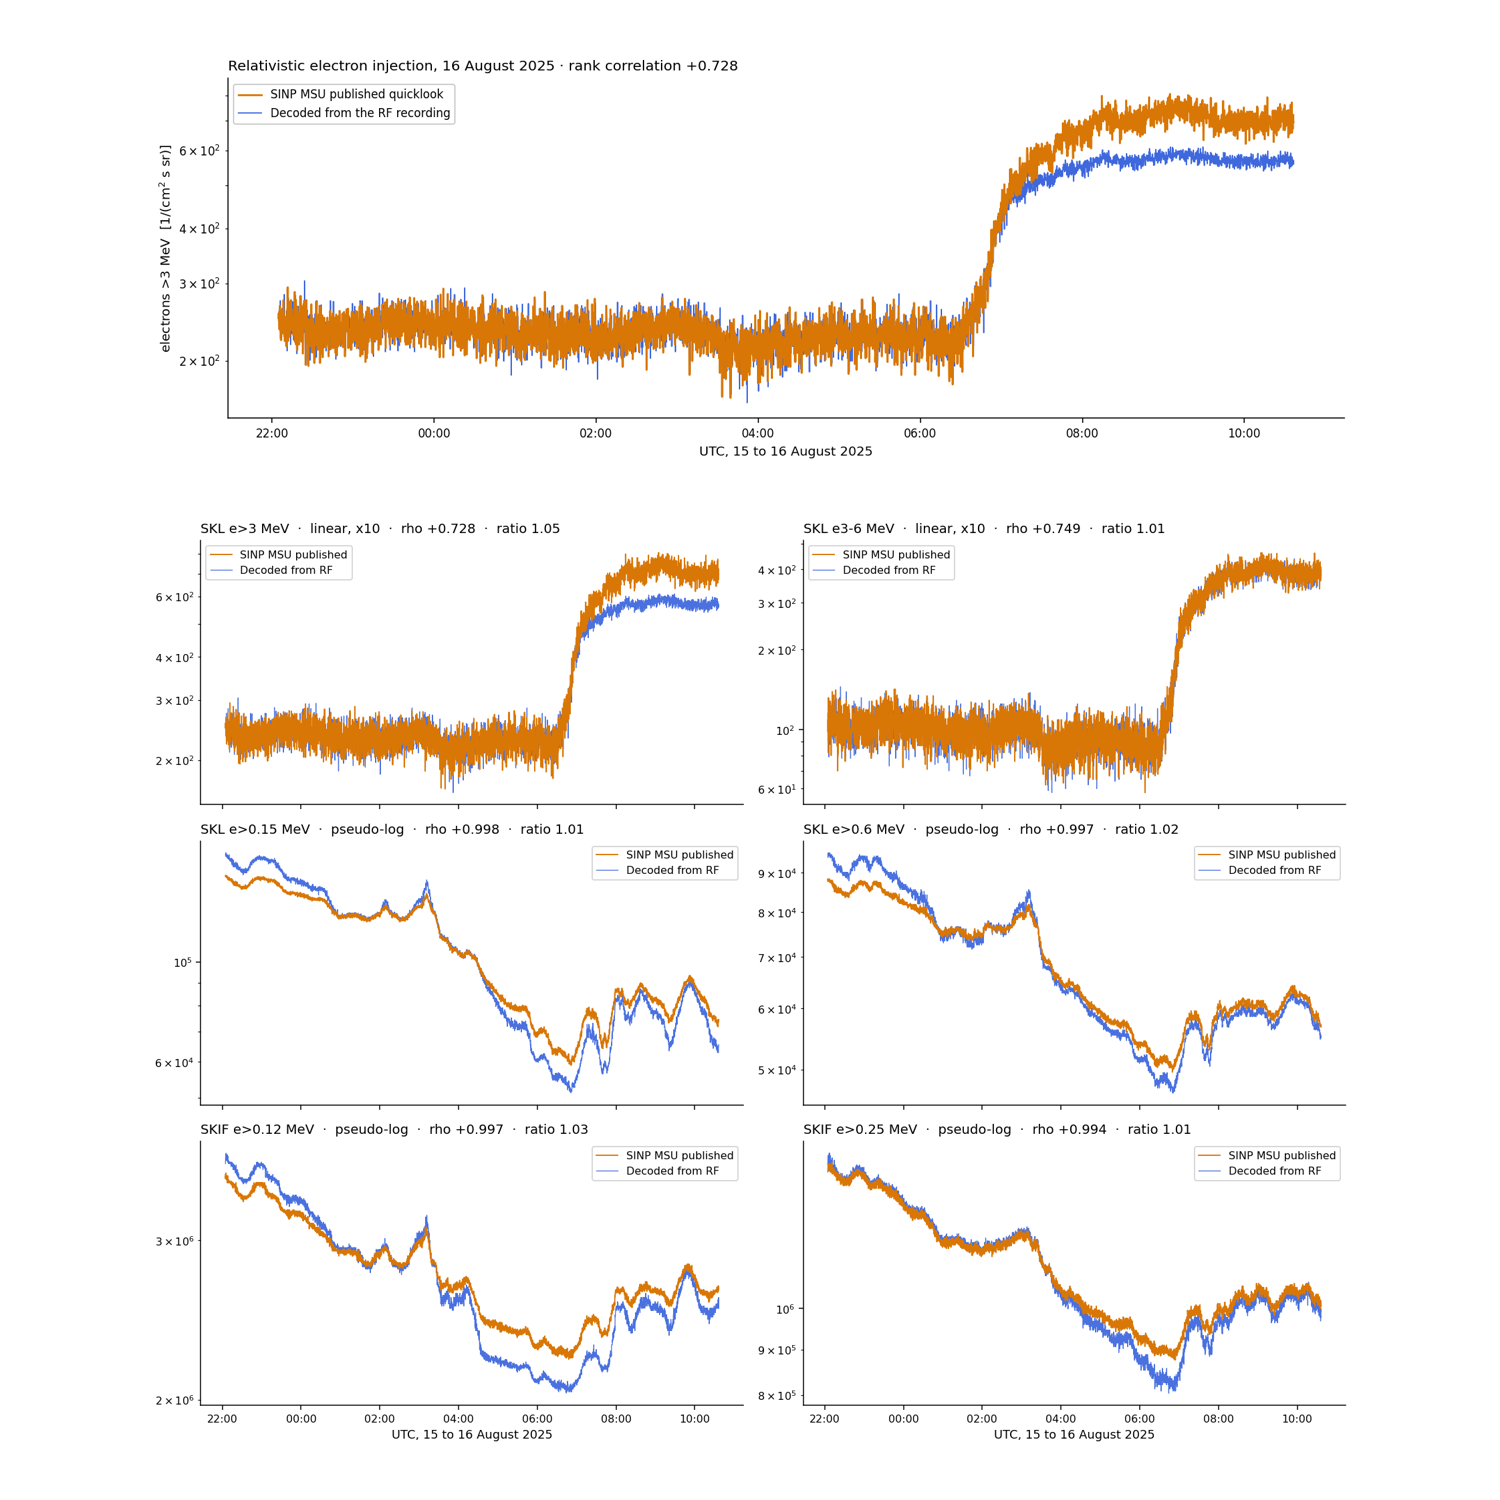
Nobody had openly decoded this Russian satellite's space-weather beacon. We did.
Read down to the byte, the electrons and protons it counts in orbit, matched to the official published data. Not weather from space. Weather of space.
Read the L2 decode →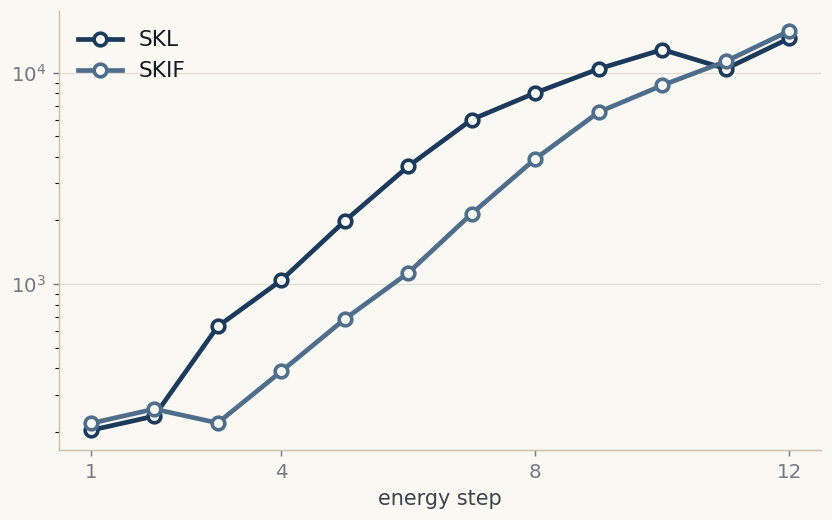
The first one we caught ourselves
The L2 decode read someone else's recording. Elektro-L5 we received on our own dish, decoded twice over on independent chains, and read through to the instruments inside: both particle detectors' own energy-sweep spectra, off our own antenna.
Read the L5 decode →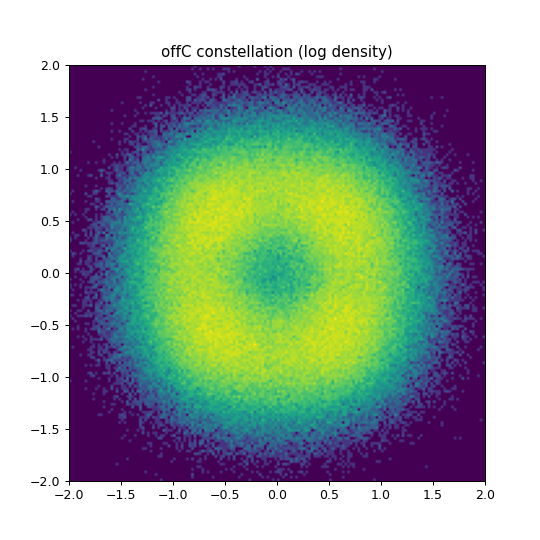
A signal that moved
A Chinese weather satellite quietly changed its downlink, so the public tools no longer lock it. We measured the new waveform from scratch and proved the decoder on a reference recording. The wall now is signal strength: the 60 cm dish is too small to pull the image.
Read the decode →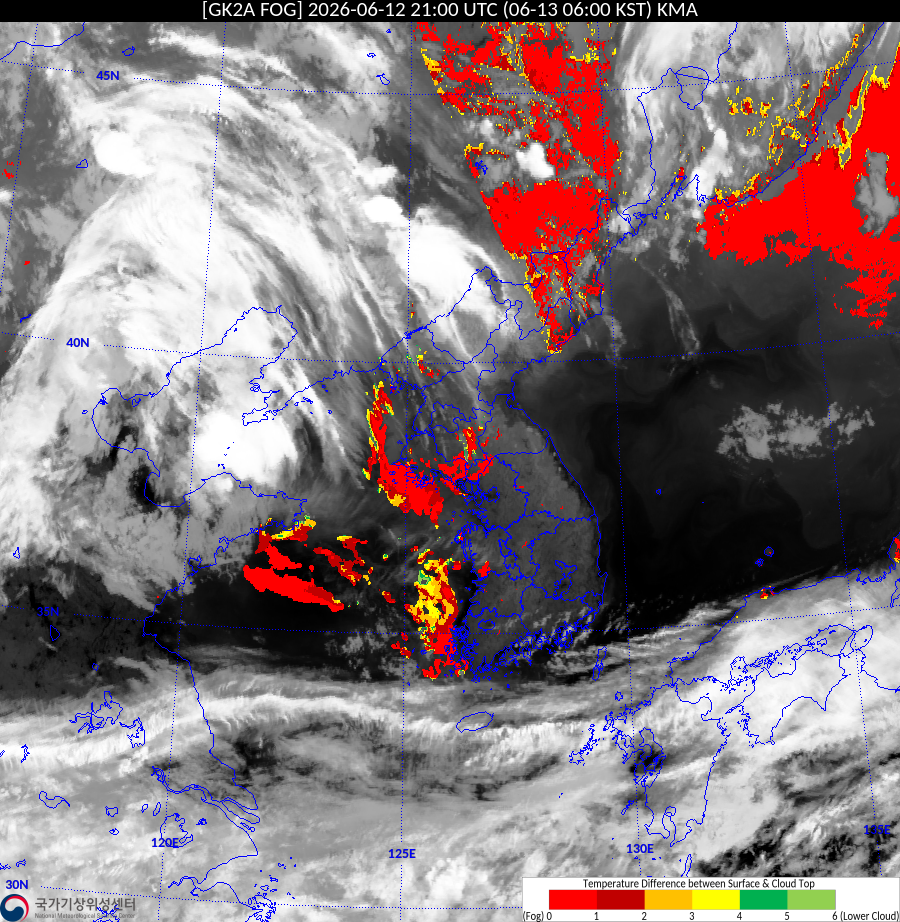
Full disks, and a hidden chart channel
The Korean downlink gives the live full-disk timelapse, and on the same signal a second channel of the weather service's own charts that almost nobody saves. We pulled out 13 of them and the daily broadcast plan.
The images and the charts →The instruments
Each plate is the output of one of three configured chains, run end-to-end without intervention. When a node breaks, the chain stops and the log entry says where. See all three instruments →
Operational log
Latest session, 12 to 13 June 2026: a single continuous overnight run on the 3D-printed 60 cm dish in Mumbai, unattended, one RTL-SDR. 119 full-disk IR105 frames (116 kept in the timelapse, three dropped, an evening fade window repaired frame by frame), plus 13 KMA chart products and the day's operation plan off the same downlink. Decoded with SatDump, colorized with Sanchez. Recording stopped at the end of the session.
| No. | Captured | Satellite | Outcome | Band | SNR | CADU | Pipeline / Note |
|---|---|---|---|---|---|---|---|
| 64 | 2026-07-14 · 13:00Z | FENGYUN-2G | Decoded | L | · | · | SatDump fengyun_svissr → counter correction → geometric circularisation → line repair by interpolation → visible/infrared LUT false colour |
| 63 | 2026-07-14 · 06:00Z | FENGYUN-2G | Decoded | L | · | · | SatDump fengyun_svissr → counter correction → line repair by interpolation → visible/infrared LUT false colour |
| 62 | 2026-06-15 · 17:00Z | GEO-KOMPSAT-2A | Decoded | L | · | · | SatDump gk2a_lrit (calibrated BT) → equirectangular reprojection → Blue Marble + borders |
| 61 | 2026-06-15 · 09:51Z | GEO-KOMPSAT-2A | Partial | L | · | 1353 KiB | SatDump · auto-ingested from canonical.json |
| 60 | 2026-06-13 · 07:20Z | GEO-KOMPSAT-2A | Decoded | L | · | 323016 KiB | SatDump v2.0.0-alpha · gk2a_lrit |
Full log, 64 sessions on file →
Sessions are logged in the order they completed, failed captures included.
SNR is post-DC-block baseband estimate, not link-budget margin. The full archive
lives on the NAS at /satellite/.processed-iq-log.ndjson; this table
is the daily-refreshed projection.